FLOW. Measure, understand, and optimize visitor flows in real time.
CALA. transforms invisible visitor flows into actionable insights – interests, movement patterns, visitor paths, and dwell times, all captured anonymously and made available in real time. This makes data-driven decisions, smart resource planning, and measurable ROI the standard rather than the exception.
What Is Flow Management?
CALA's Flow Management reveals how visitors move through your spaces in real time: Where do hotspots emerge, which routes are preferred, and how long do visitors spend at individual Points of Interest (PoIs)?
Overhead-mounted sensors and AI-powered algorithms provide precise, fully anonymized data on visitor numbers, movement patterns, and dwell times – including automatic detection of high-traffic zones and potential bottlenecks. Each PoI is ranked by visitor numbers, dwell time, and peak periods.
All insights are available in a live dashboard, complemented by daily reports, a strategic Executive Summary, and benchmarks across multiple days and events – providing the foundation for smart Flow Management.
CALA. tracks in real time how many people move through different areas and how long they stay in specific locations.
The analysis automatically identifies zones with particularly high visitor traffic or areas at risk of becoming bottlenecks.
All Points of Interest are ranked by visitor numbers and dwell time, including their respective peak periods.
All results are available in a live dashboard, complemented by daily reports and a strategic Executive Summary.
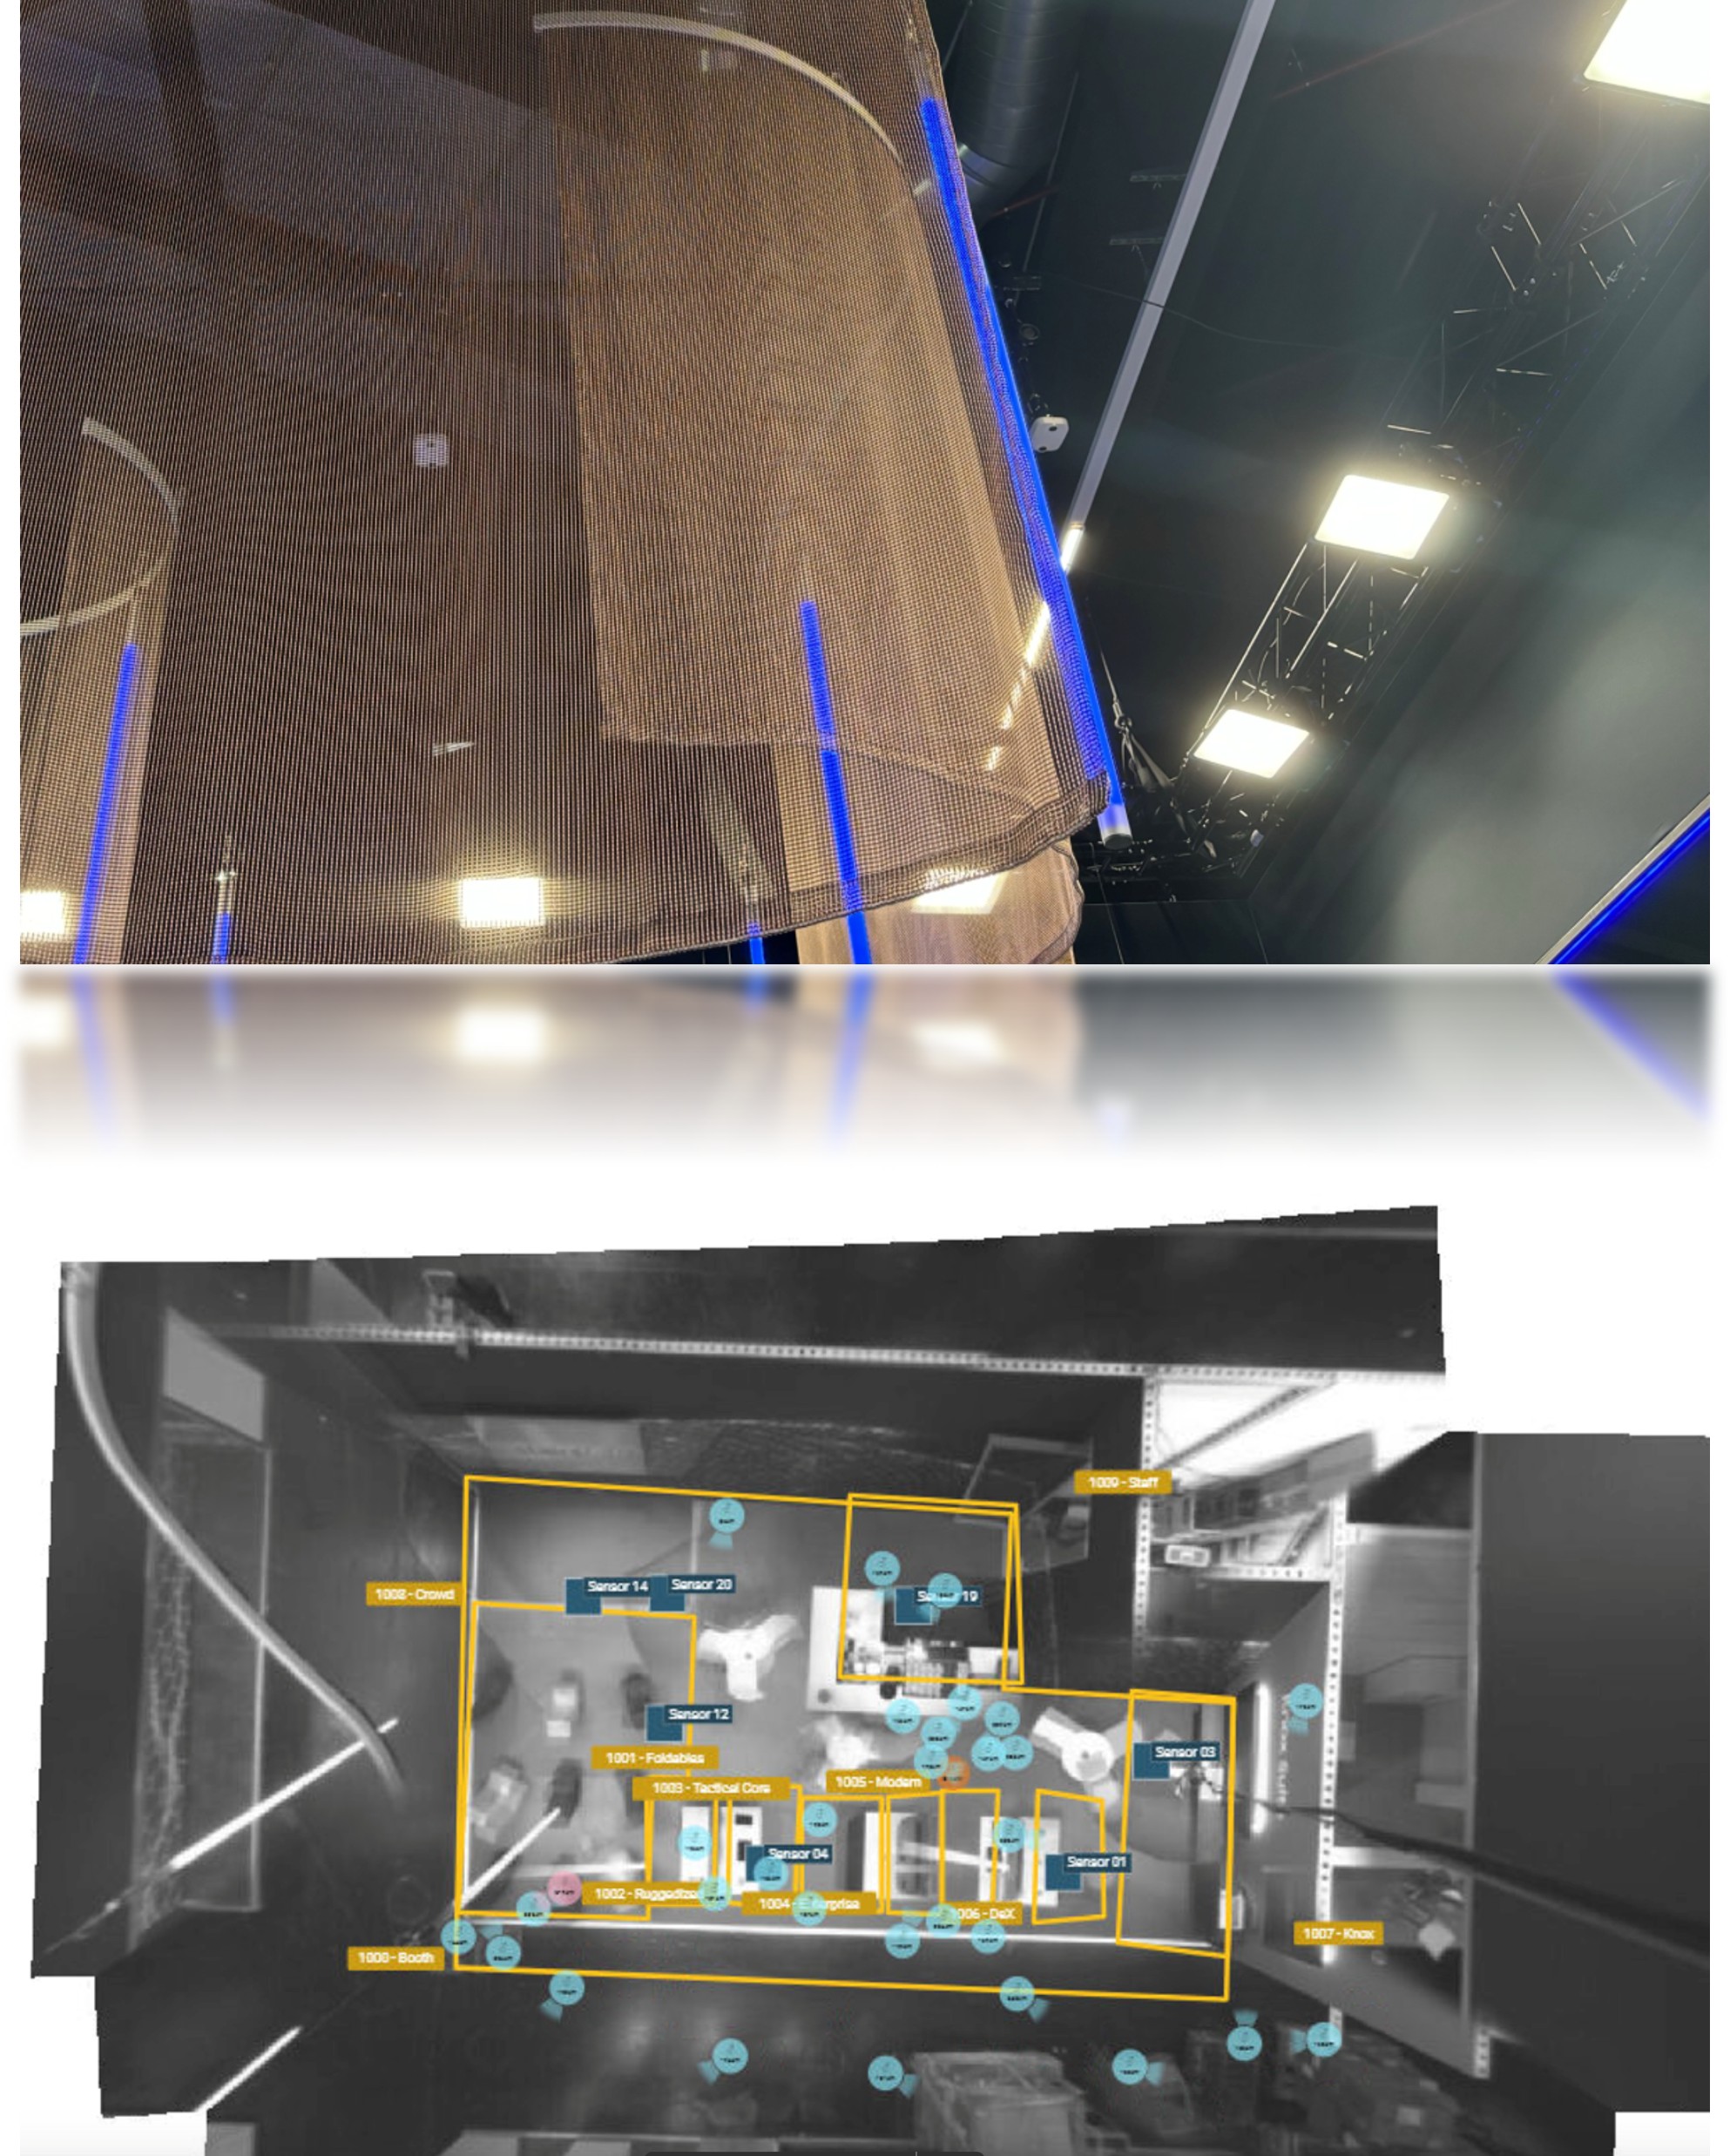
In addition to Flow Analysis, CALA. also measures visitors' emotional responses to products and topics, revealing which content truly captures their attention [learn more under PULSE].
Understand Visitor Flows, Identify Product Interest

Understand Visitor Flows, Identify Product Interest
Understand Visitor Flows, Identify Product Interest
See in real time what visitors are truly interested in: Which products, touchpoints, or topics attract the most customers, and where do visitors spend the most time? Turn movement data into a solid foundation for product placement, product range optimization, and space utilization.
Make Attractiveness Measurable
Compare PoIs, product areas, or program activities based on visitor numbers and dwell times – and invest strategically in what truly attracts attention. You can also measure how visitors respond to products or topics on a cognitive and emotional level – learn more under PULSE.
Optimize Booth and Space Planning with Data
Compare your planned layout with actual visitor behavior and identify underutilized areas.
Deploy Staff and Resources Efficiently
Allocate staff, signage, and infrastructure precisely where they are needed most.
Learn and Improve from Event to Event
Compare days, event formats, and venues to continuously optimize performance and increase ROI. If desired, you can also compare engagement rates across different product categories – ideal for A/B testing presentations or topics – learn more under PULSE.
How Does the Technology Work?
Sensors discreetly positioned above the monitored area continuously capture all relevant movements – accurately, reliably, and fully anonymously, without identifying individual people.
The collected data is processed by AI-powered algorithms that automatically detect visitor numbers, typical movement paths, dwell times, usage of individual Points of Interest, and peak periods, translating them into clear, actionable metrics.
All insights are presented in visual dashboards featuring heatmaps, path analyses, PoI rankings, dwell time analytics, and benchmark comparisons, enabling fast, well-informed decisions.
Data Protection & Compliance
CALA. does not collect any personal data, and camera images are never stored; instead, they are immediately processed into anonymized datasets.
All generated data is stored exclusively as fully anonymized records within a secure cloud infrastructure located in Europe.
All data collection and processing strictly comply with GDPR requirements and meet all relevant data protection standards.
Staff Exclusion: Clean Data for Better Decisions
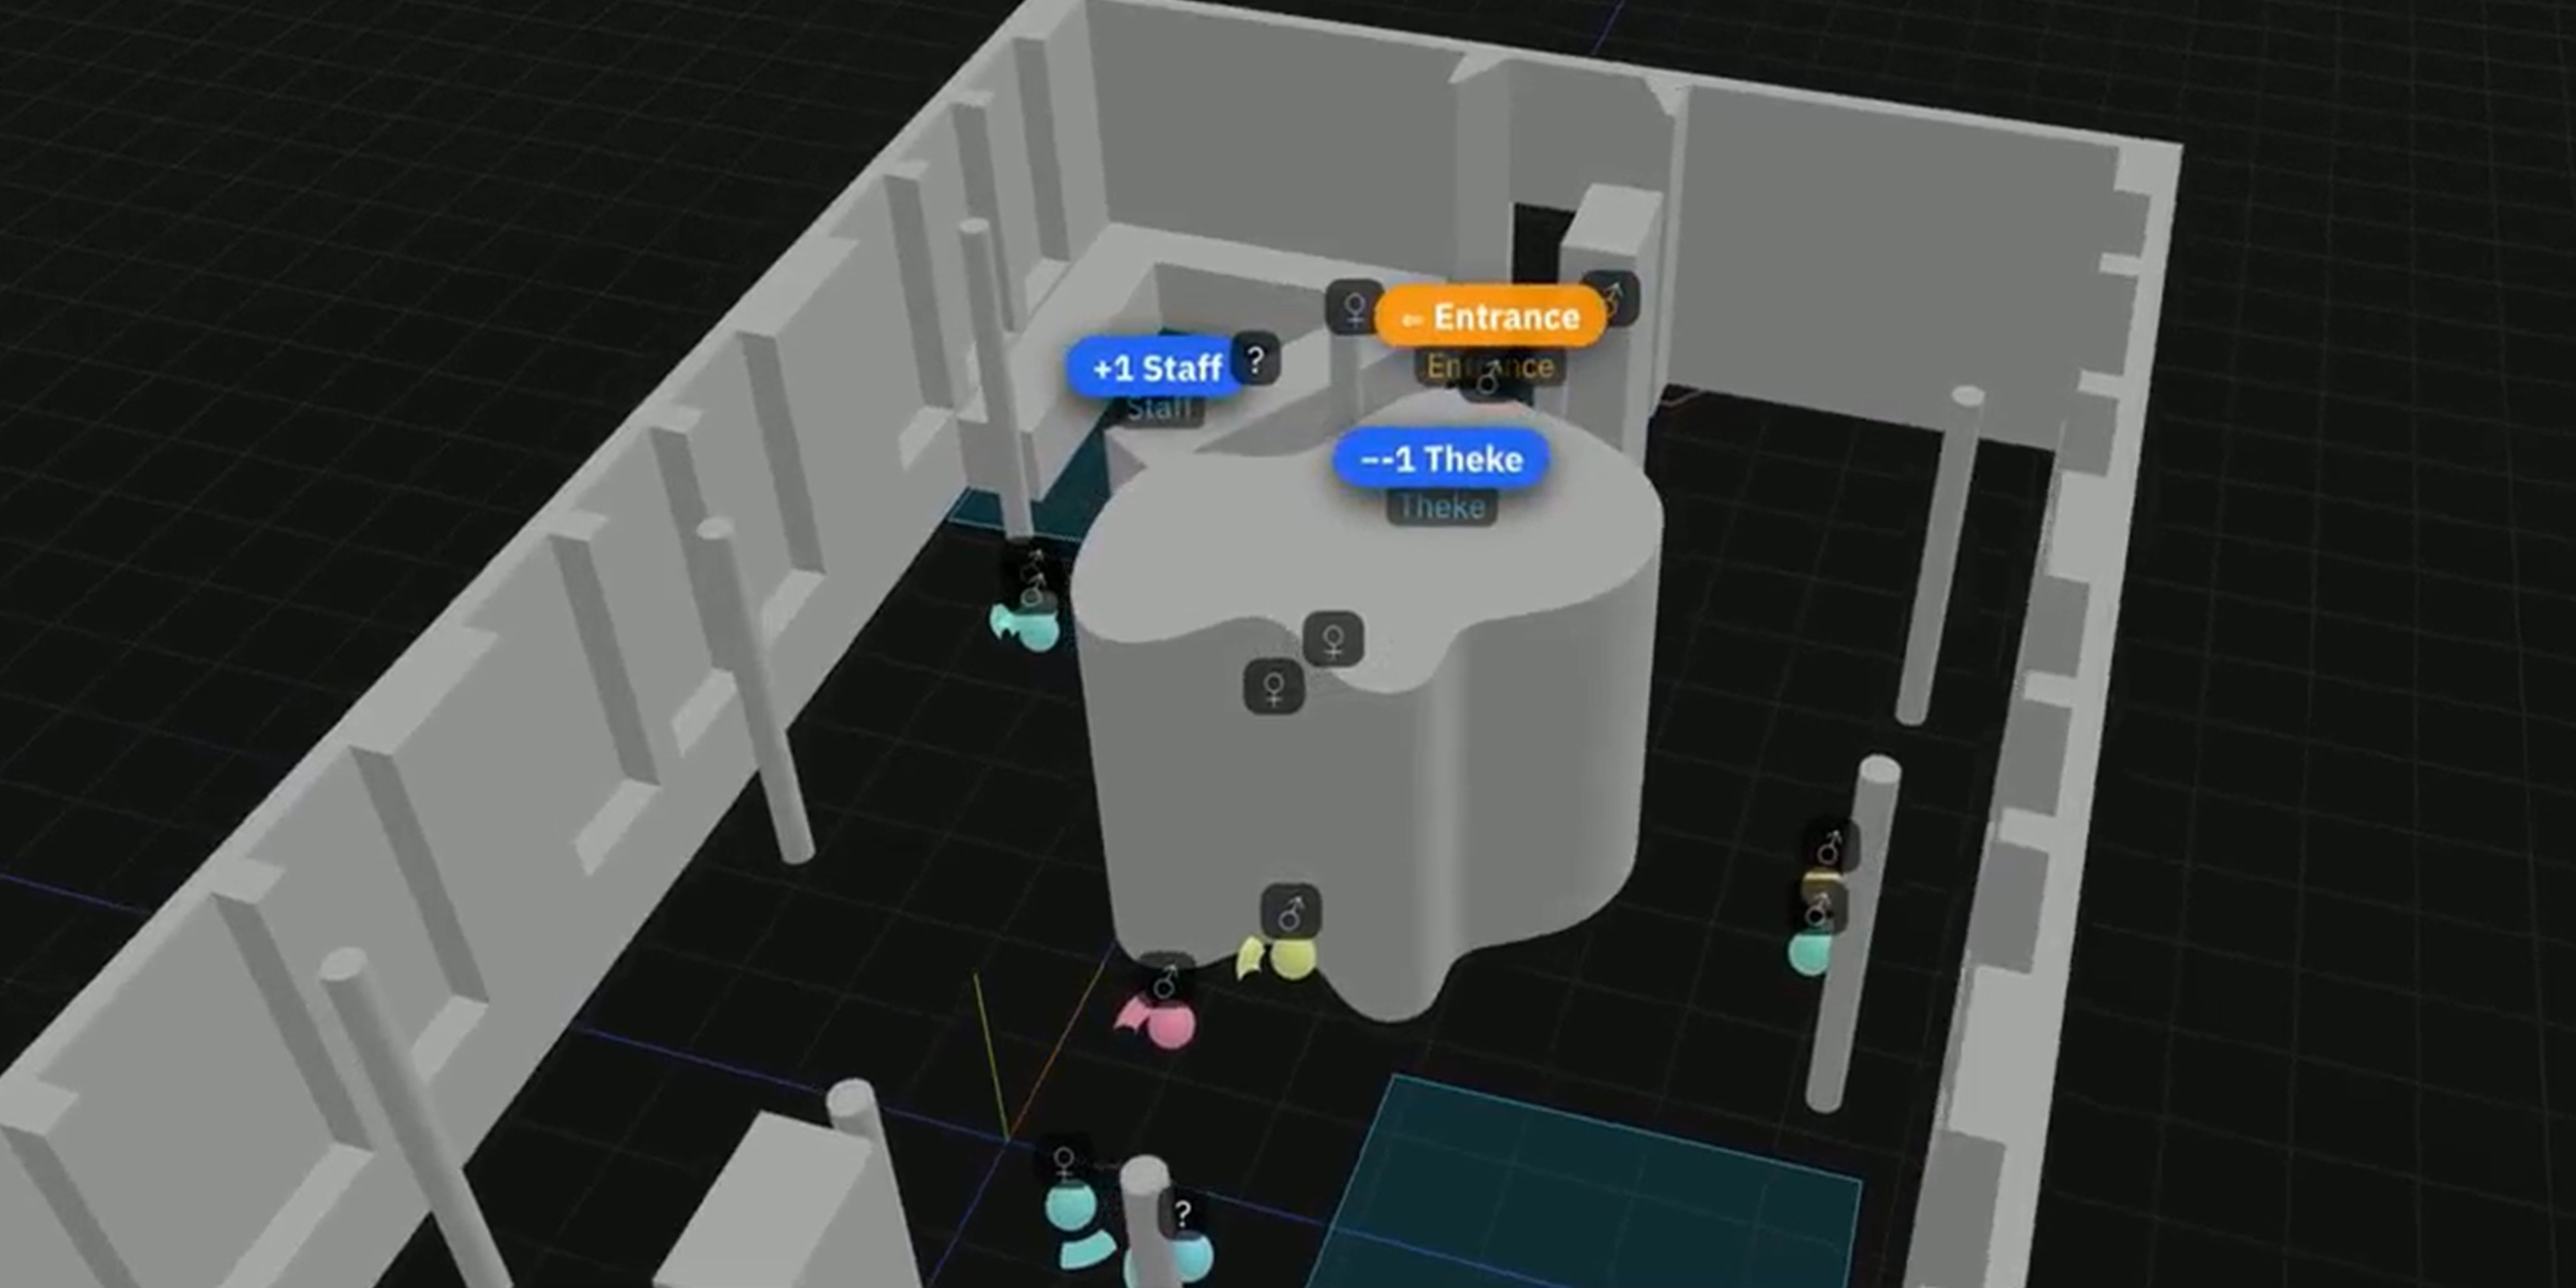
With the new "Staff Exclusion" upgrade, CALA. enhances its Flow Analytics solution with a key feature: the precise distinction between visitors and staff.
Visitor numbers and dwell times already provide a solid foundation for analyzing event, trade show, and venue performance.
The enhanced approach is based on a clear operational logic:
Specific areas and access points are defined as staff zones – such as welcome counters, back-office areas, or bar and catering areas.
As soon as a person crosses these designated zones or boundaries, they are automatically identified as staff and classified accordingly for the duration of their stay. Once the person leaves the monitored area, a new identification takes place upon re-entry.
New KPI: Sales Interaction Rate Between Staff and Visitors Complements Cost per Lead
This classification introduces an additional sales-related performance indicator: the Sales Interaction Rate between staff and visitors. It enables precise measurement of both the number and duration of interactions, including sales and consultation conversations.
This new Sales Interaction Rate can be measured separately for each product category or area, enabling a more comprehensive evaluation of sales performance and complementing the core KPI of Cost per Lead at events.
This makes Flow Analytics not only more accurate but also significantly more valuable for the strategic management of events and trade shows.
Typical Use Cases
Trade Shows & Exhibition Booths
Identify which products and topics attract the most attention, and optimize your booth design, visitor flow, and event program.
Conferences & Corporate Events
Manage visitor flows between stages, breakout rooms, expo zones, and service points.
Venues, Arenas & Festivals
Enhance safety, comfort, and revenue through intelligent crowd and visitor flow management.
Brand & Retail Spaces
Place content where attention and conversion potential are highest.
Find out more about Retail & Permanent Installation
What You Get
To effectively optimize events, exhibition booths, or venues, you need measurable results that clearly show how visitors actually use your spaces. Flow Management provides exactly this clarity: It reveals which areas perform well, where opportunities for improvement exist, and which measures deliver the greatest impact. These insights transform assumptions into evidence-based decisions, enabling you to manage programs, layouts, and resources in a targeted and effective way.
You get a clear, intuitive live dashboard that visualizes all movement data through heatmaps, visitor paths, and a ranking of the most frequently visited Points of Interest.
Daily reports provide a clear and concise overview of how many visitors used each area, how long they stayed, and when activity levels were highest.
You also receive a strategic summary that evaluates the key findings and provides specific recommendations for optimization.
Compare your results across different days, event formats, or individual Points of Interest to quickly identify trends and patterns.
If desired, different booth or space layouts and product placements can be compared to identify which option performs best based on data-driven insights.
The Sales Interaction Rate enables accurate, non-personal tracking of all sales interactions at the exhibition booth and within defined product areas, as well as the evaluation of generated leads in relation to the total number of customer interactions.
Your Booth in Focus: Data That Drives Impact
The exhibition booth is the central space where brands, products, and messages come together – and this is exactly where CALA | FLOW comes in: We reveal how visitors actually use your booth, which areas attract attention, and where untapped potential lies. By precisely analyzing visitor paths, dwell times, and interaction points, we transform your booth concept from a static presentation into a measurable experience that you can strategically optimize and continuously improve.
A Complete Overview of All Booth Activity
By monitoring the entire exhibition booth, we gain insights into overall visitor traffic, how visitors move throughout the space, and which routes they prefer, enabling data-driven optimization of the overall visitor experience.
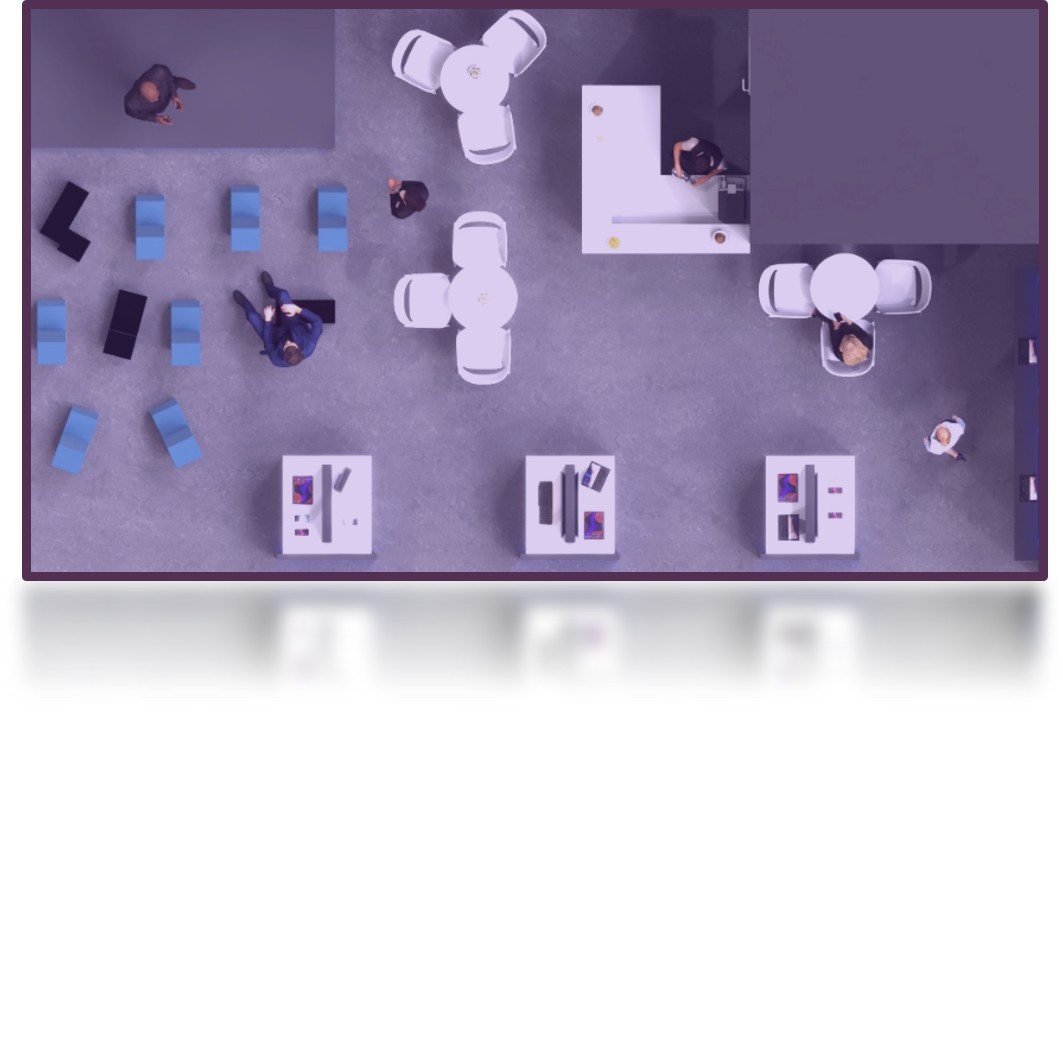
Understanding Attention & Engagement During Booth Presentations
Analyzing the stage area shows how many visitors attend your presentations, how long they stay, and which topics generate the strongest pull.
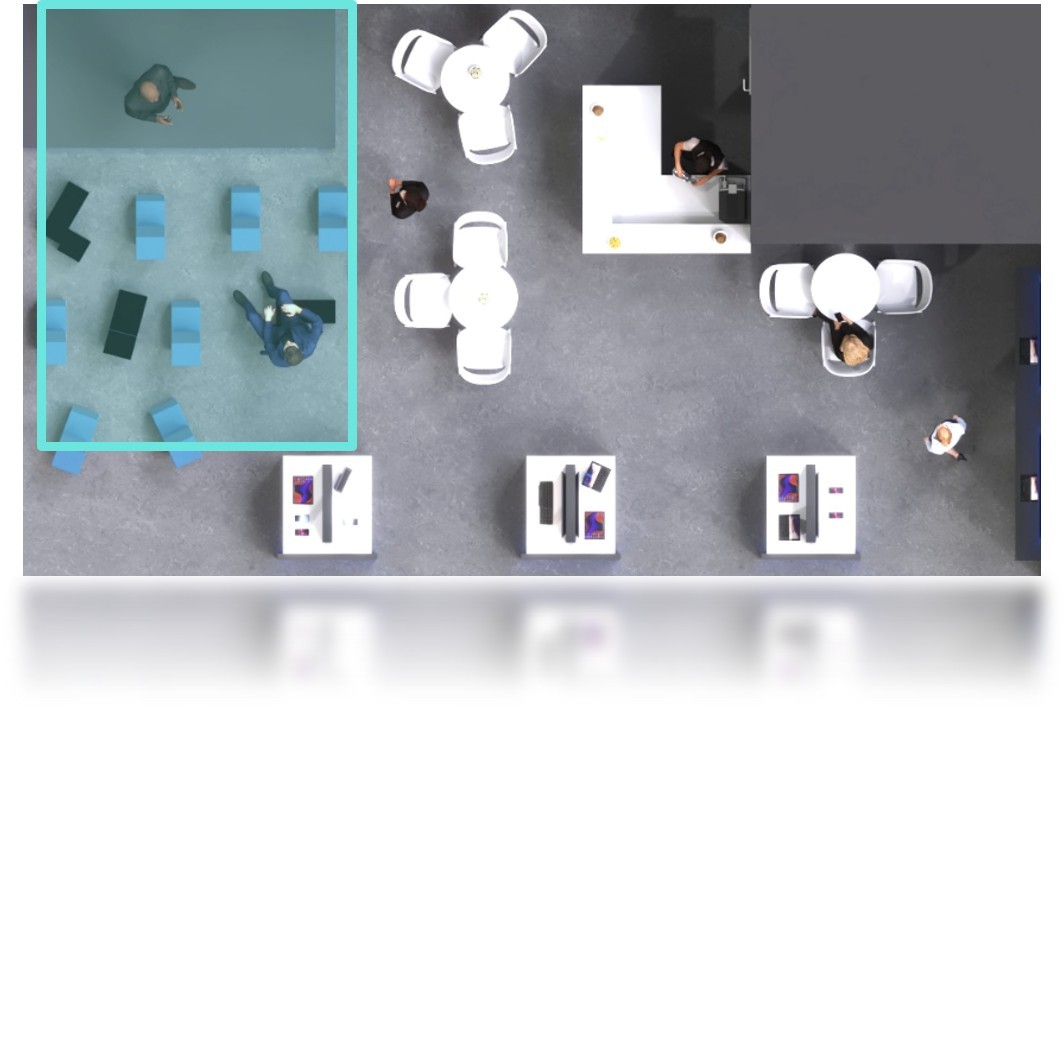
Measure Engagement with Information Displays and Media Screens
Tracking visitor flows around displays reveals how effectively visual content attracts attention, how actively visitors engage with it, and whether the display's location generates the desired level of interest.
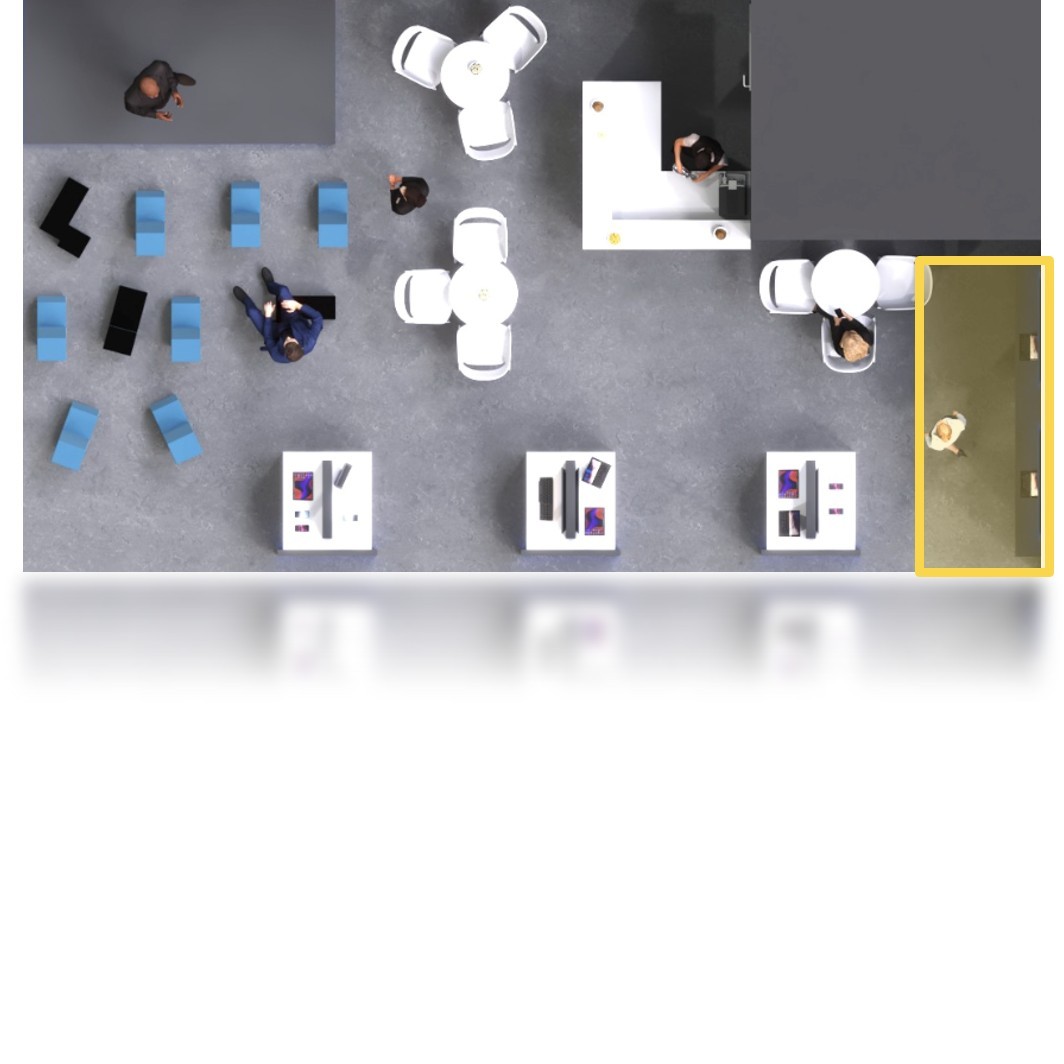
Measure Interest and Engagement Directly at the Exhibit
Product-level tracking reveals how many visitors actually engage with an exhibit, how long they stay, and how attractive the product presentation is compared to other areas. In addition, CALA. can measure emotional responses to individual exhibits and identify which products or variants generate higher engagement rates.
Learn more under PULSE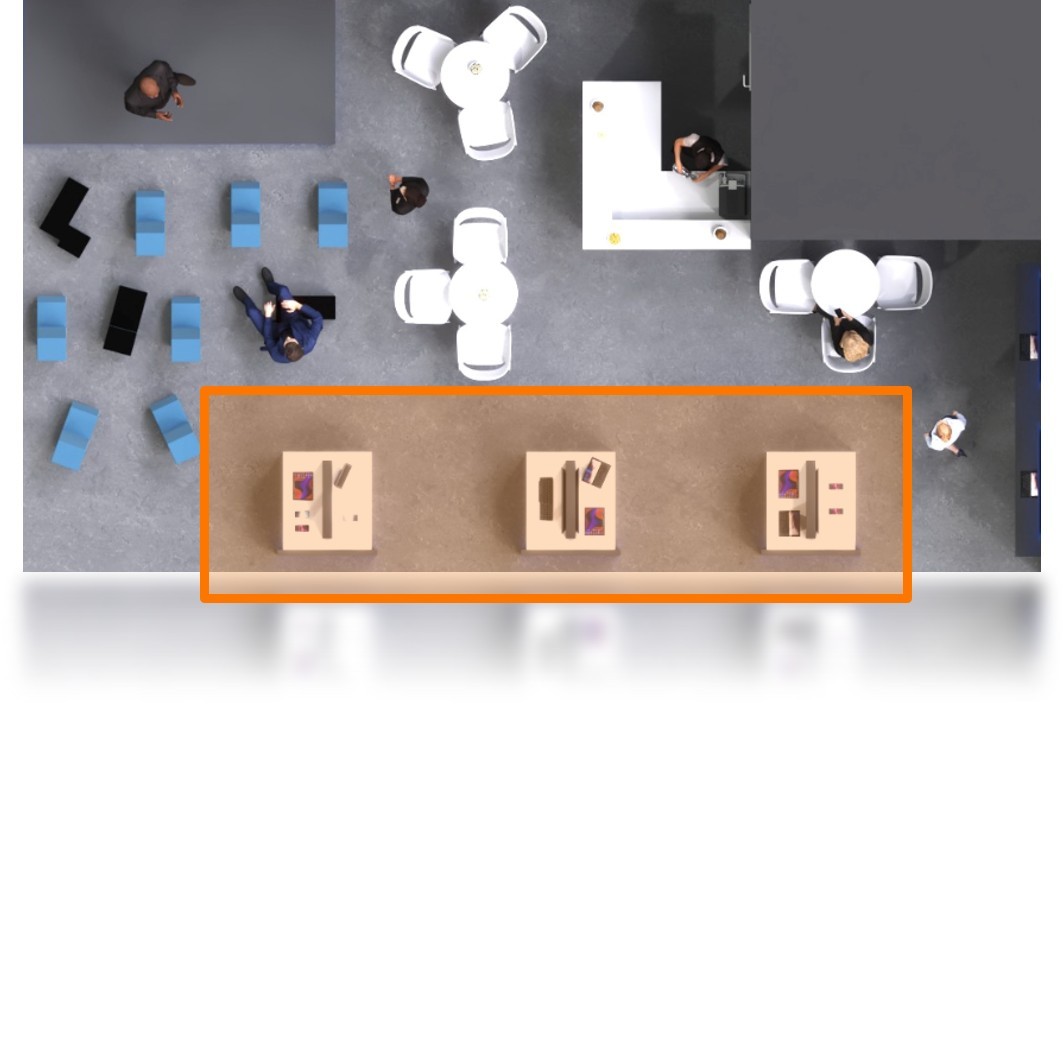
Q&A - Your questions, our answers
Flow Management
Question: How does CALA. track what’s happening at my booth?
Answer: We use discreetly positioned sensors and AI-powered analytics to track in real time how many people move through different areas and how long they stay in specific locations – fully anonymized and without collecting personal data.
Sales & Service Processes
Question: How does this benefit my sales team or staff?
Answer: The analytics show which areas attract the most visitors and where they spend the most time. This allows you to deploy staff where they are needed most, improve customer service, and maximize sales opportunities.
Interest Ranking
Question: Why is it important to know which products or topics interest visitors the most?
Answer: Because it allows you to immediately identify which content performs well, which attracts less attention, and where optimization or strategic repositioning can deliver real added value.
Visitor Paths
Question: Why do I need visitor path analysis?
Answer: The data helps you understand how visitors move around your exhibition booth, which routes are most popular, and where potential bottlenecks may occur. This allows you to increase product interest and brand awareness.
Products & Content
Question: Can I find out which PoIs are the most successful?
Answer: Yes, you can see exactly which Points of Interest attract the most visitors, how long visitors stay, and how your different content performs in direct comparison. In addition, we can identify how visitors respond emotionally to products and content, and whether certain presentations generate stronger engagement [learn more under PULSE].
Meet our experts
Take advantage of the opportunity for personal discussions and mentoring with our specialists: